![]()
Today I am devoting myself to the topic of service mesh and want to bring you a little closer to linkerd. Tom has already shown us Istio and provided us with a very good starting point to take a closer look to another service mesh platform.
Like Istio, Linkerd is a service mesh. Before I go deep into the topic, I want to take a step back and explain what exactly a service mesh is and why it is worth using it.
In principle, a service mesh controls how different parts of an application can share data with each other. The service mesh is integrated directly into the application without the need of touching the application code itself. This is possible by placing a proxy in front of the application, which accepts all requests and then forwards them to the application.
The advantages become clear very quickly. For example, if you want to make a service available only to authorized users, you can centrally control this behaviour via the service mesh and you do not need to implement the logic for each application. If you want a deeper look into the subject, you should definitely read again the blog post from Tom.
facts about linkerd
Linkerd is an open source project (Apache 2.0 license) and was launched in 2015. The developers of linkerd are former Twitter employees and founded the company Buoyant, which offers a managed linkerd platform. The project is jetzt ganz frisch a CNCF Graduated Project and is now available in version 2.10.2. According to the company, there are over 200 contributors who are actively involved in the project. Linkerd itself is mostly written in Go, but the proxies were written in Rust.
architecture by linkerd
Linkerd basically consists of a control plane and a data plane. There is also a very clear UI and a few other components. Let’s take a quick look at the architecture in detail.
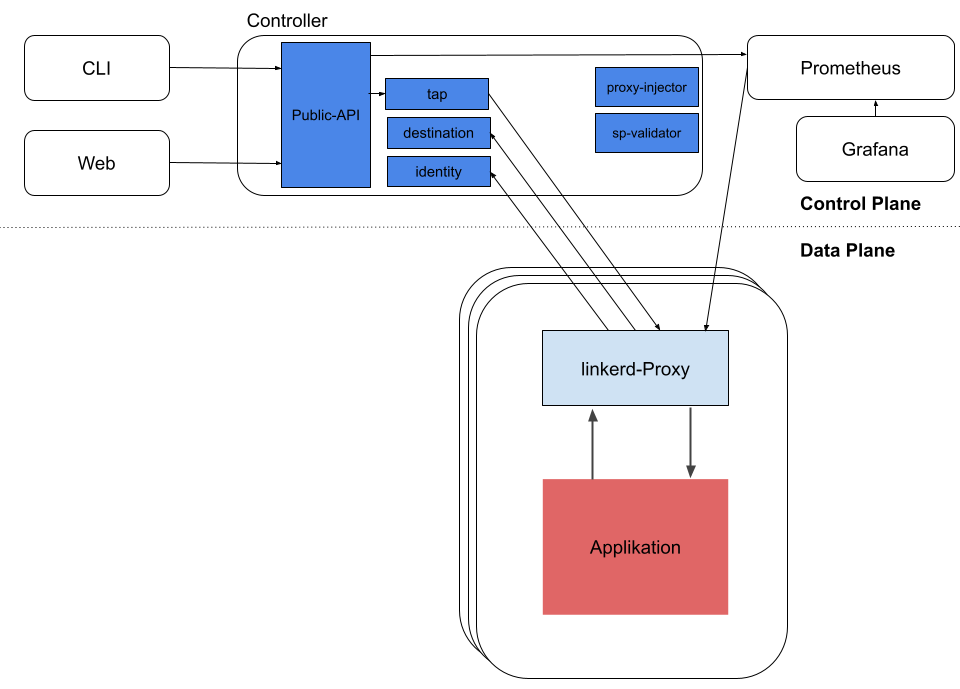
Control plane
The control plane offers services that are located in their own namespace (linkerd). These services are responsible for various tasks, such as aggregating telemetry data or offering an API for the CLI and the web UI. The control plane also provides data to the data plane proxies in order to control the behavior of the data plane.
The control plane consists of the following components:
Web + CLI
The web deployment provides us with the linkerd dashboard. The CLI can be installed on several systems in order to communicate with the public API.
controller
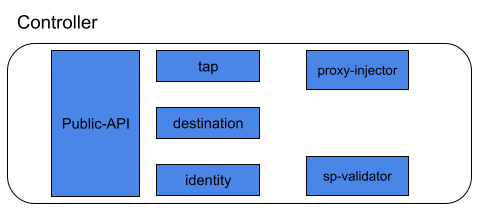
As already mentioned, the Public API offers the interface to the CLI and the UI. The destination component ensures that every proxy in the data plane knows where requests should be sent.
The identity component provides a certificate authority. With this, proxies can have certificates issued in order to implement mTLS.
The tap component accepts requests from the CLI and the dashboard to show real-time monitoring of requests and responses.
The project injector is an admission controller that creates a pod triggered by a webhook. If a pod has set the annotation linkerd.io/inject: enabled, the proxy injector provides an init container and a sidecar container with the actual proxy.
The service profile validator is also an admission controller which validates new service profiles before they are saved.
monitoring
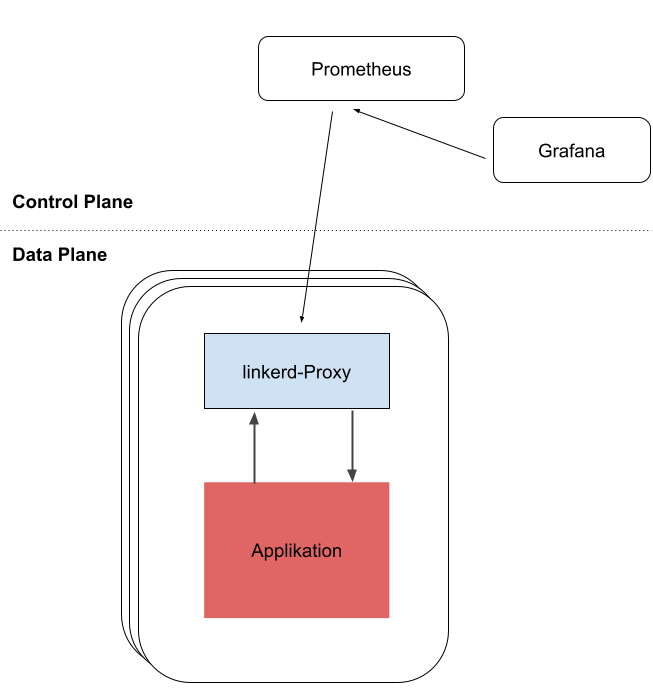
Linkerd offers us a comfortable view of the resources that are running in our cluster. Prometheus and Grafana play a crucial role in the preparation and visualization of this data.
Prometheus is a cloud native monitoring tool which collects and stores all metrics. Linkerd installs Prometheus as part of the Control Plane, so that this data can be made available to the CLI by the Dashboard and Grafana.
Grafana offers us dashboards to monitor our components. In the linkerd dashboard there are links to all resources that lead us to the corresponding Grafana dashboard.
Data Plane
In addition to the control plane, there is the data plane, which produces the data for linkerd. In principle, these are our application pods. In each pod, a sidecar container is started next to the actual application, which serves as a proxy for the application.
In order to receive such a container, it is necessary to set a certain annotation on the pod. You can do this either via the CLI with linkerd inject or manually via the pod specification.
The Proxy is a very small program written in Rust. This program ensures that all communication with the application, only takes place via the proxy. Not only the incoming but also the outgoing traffic is intercepted by means of an initContainer which defines iptables rules.
Now we know all the components and how linkerd works in theory. Now let’s see it in practice.
installation
First we install a local Kubernetes with kind. The installation with kind is not part of this blog post. After Kind is installed we can create our cluster with the following command.
|
|
After the cluster is runnign, we install the CLI
|
|
Before we can install the linkerd Control Plane, we first do a pre-check whether our cluster meets all requirements.
At the end of the output you should find the following:
|
|
Now we install the control plane and then check whether everything is ok.
|
|
If everything is “green”, we can now install a useful extension, which will install Prometheus, the dashboard and the metrics server for us. After that, we also run the check again to ensure that everything has been installed correctly.
|
|
We have now installed an executable linkerd on our cluster. Next, let’s take a look at the dashboard.
Dashboard
To open the dashboard we can enter the following command in the console. This ensures port forwarding to the linkerd \ - web pod and automatically starts the browser for us.
|
|
Now we should see the dashboard in the browser.
Let’s play
Now let’s take a closer look at the advantages linkerd brings us. To do this, we install the demo app emojivoto, which is also used as a sample app on the official linkerd page.
|
|
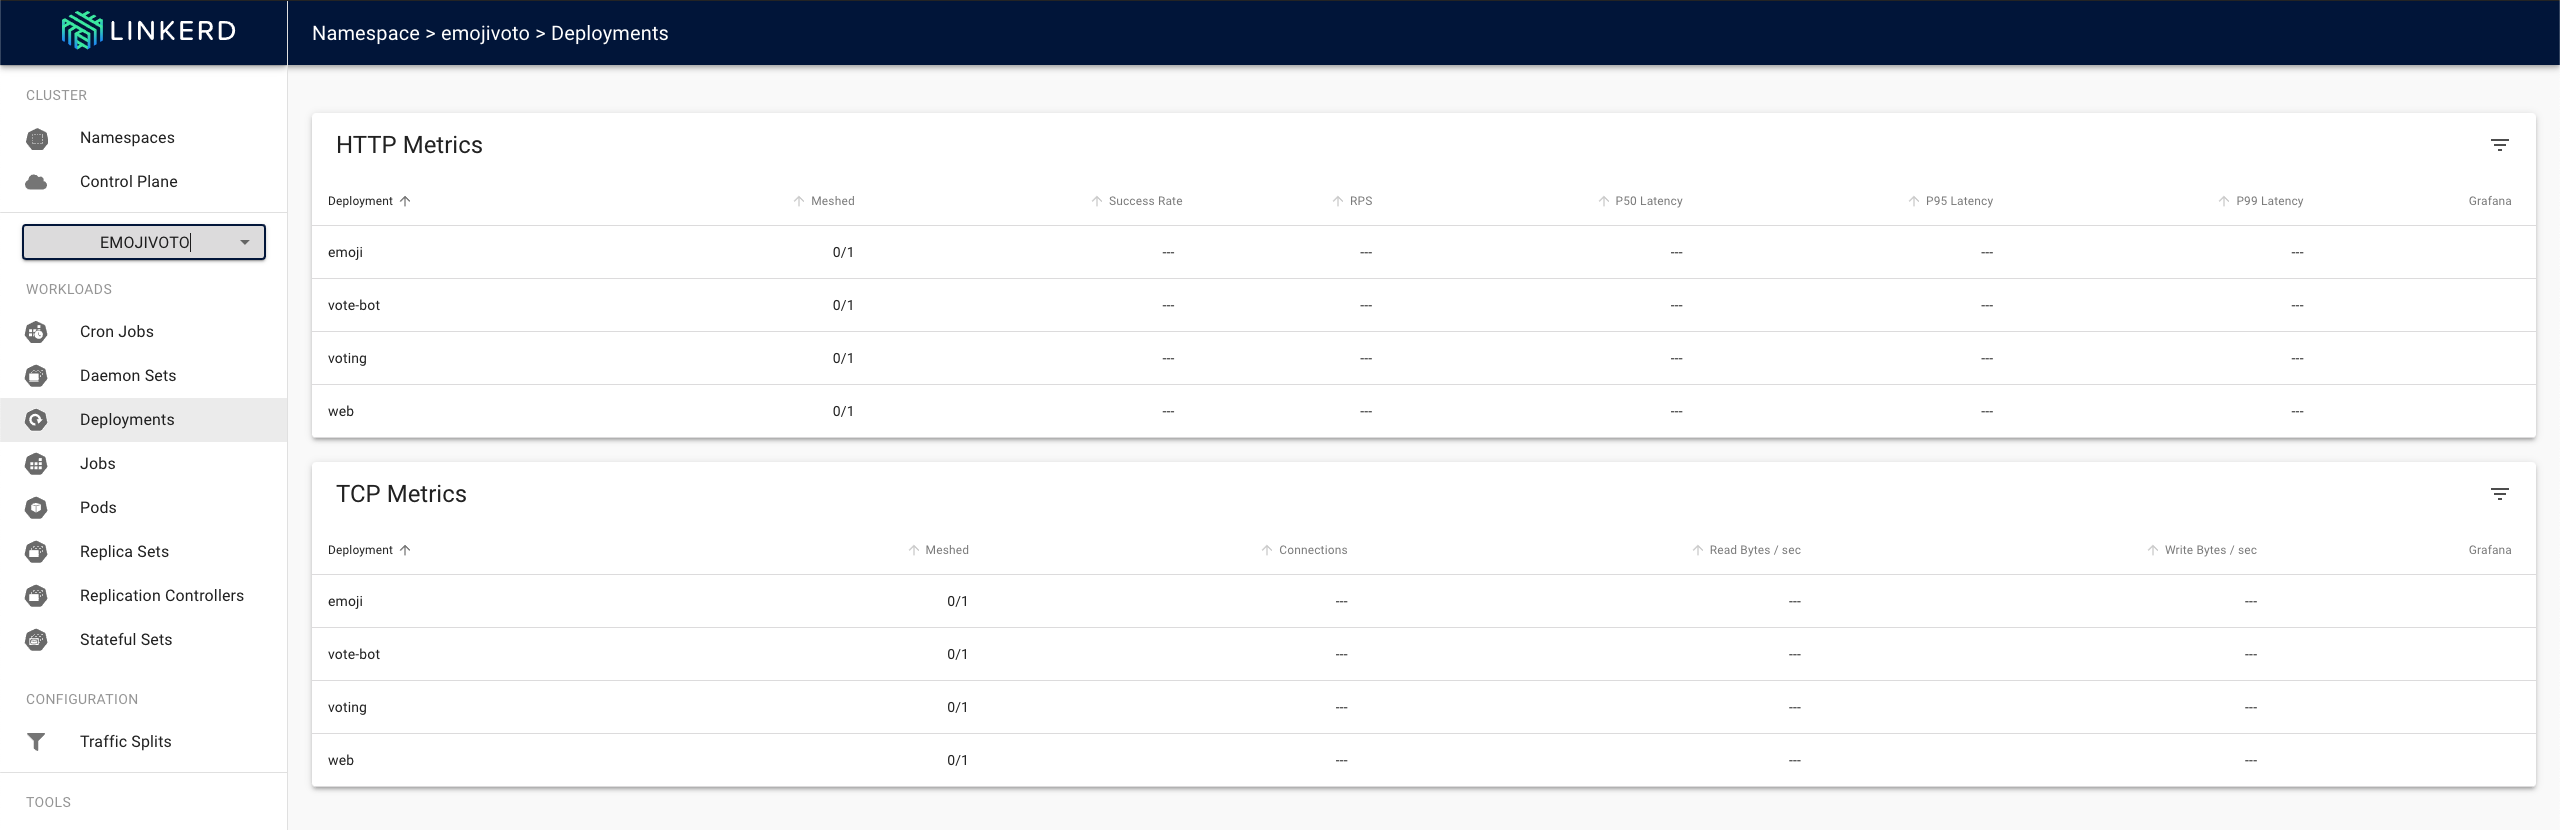
In the dashboard we can now see that the application has been installed, but we don’t see any metrics yet, as the proxy container has not yet been injected into the pod.
In order to be able to access the application, we have to set up port forwarding to the pod.
|
|
The application can then be called locally with http://localhost:8080.
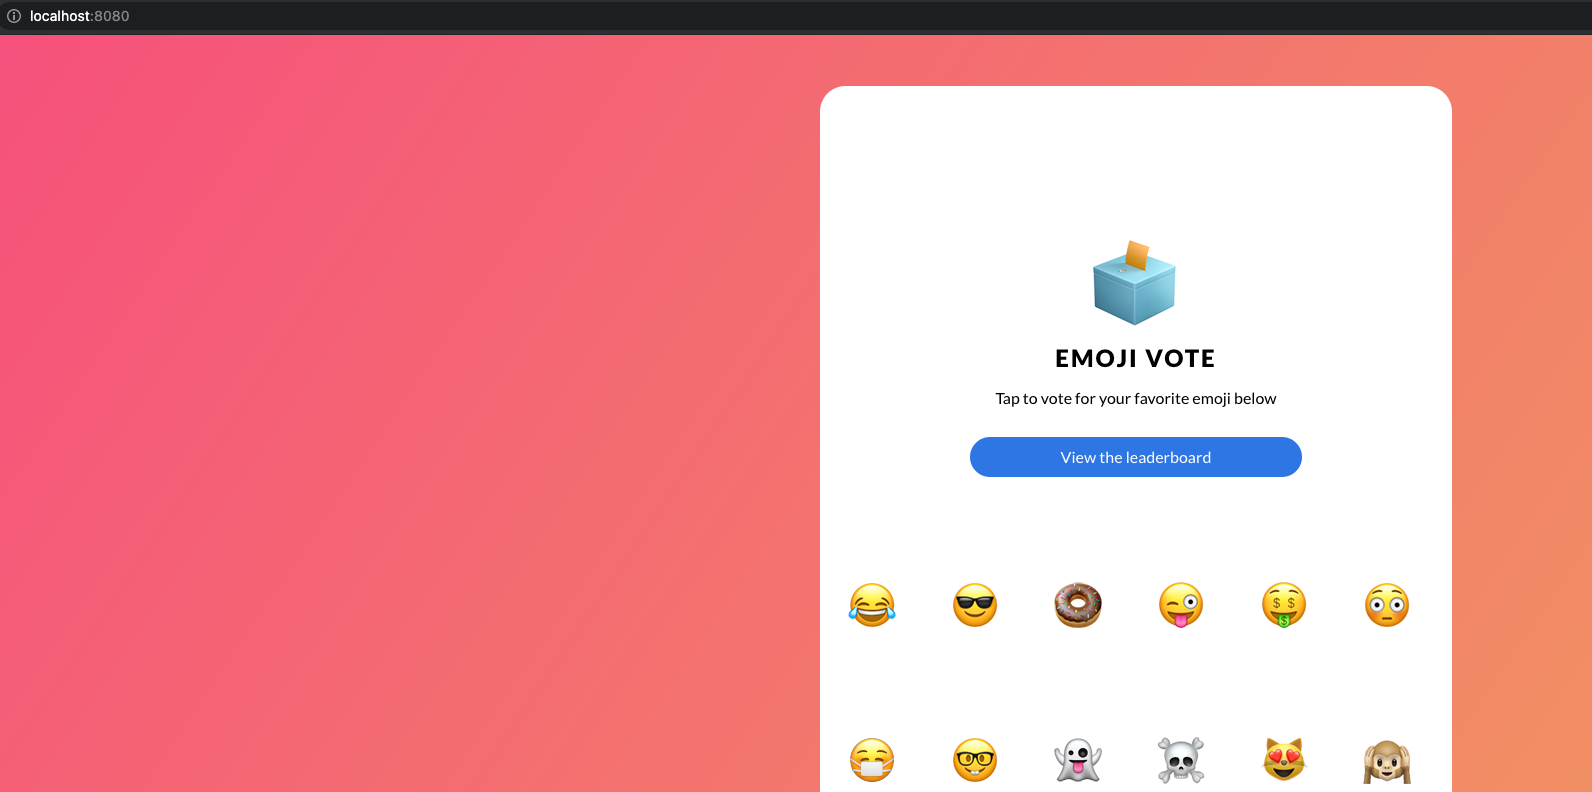
Looks good so far. Now we want to add linkerd to the application. To do this, we execute the following command, which creates the linkerd sidecar container in the deployments.
|
|
As we can see linkerd was injected into the deployments. The linkerd inject command adds special annotations to the pod specification so that linkerd knows in which pods a proxy container should be added. If we take a closer look at the pod, we can see these annotations:
|
|
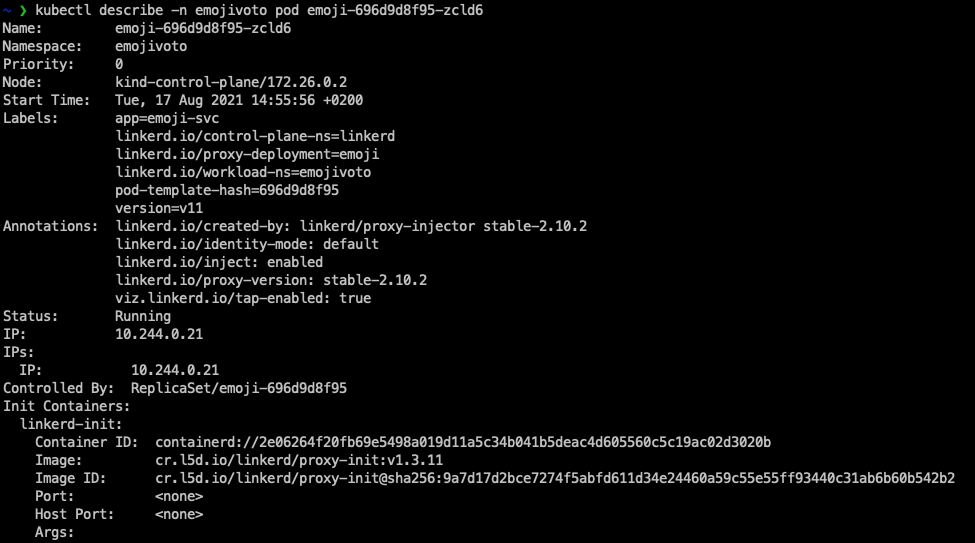
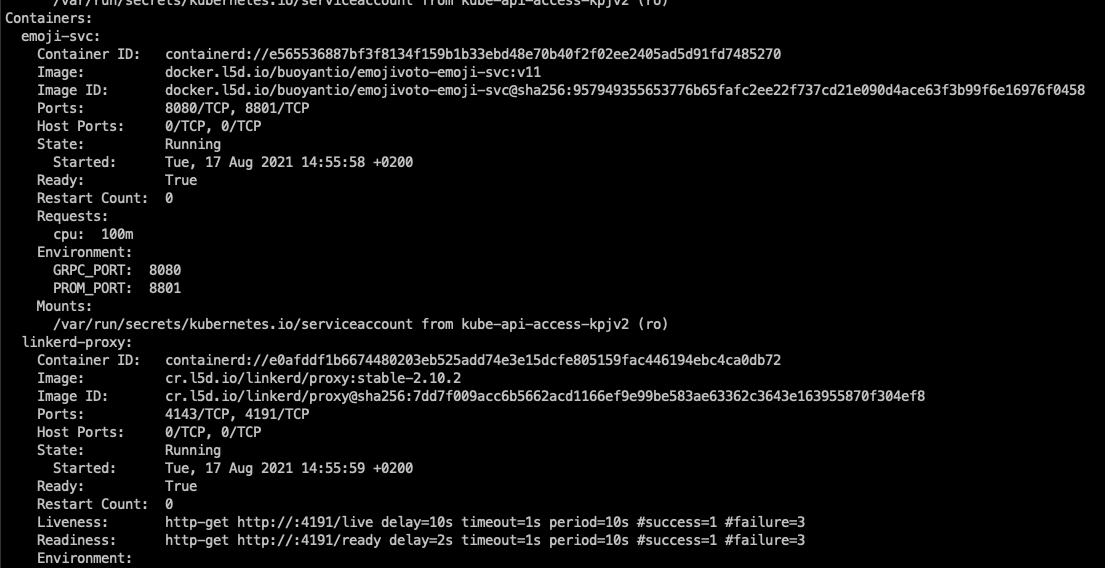
Further we can see that there is a second container in the pod.
Another way to check if the proxy is running properly is via the linkerd CLI
|
|
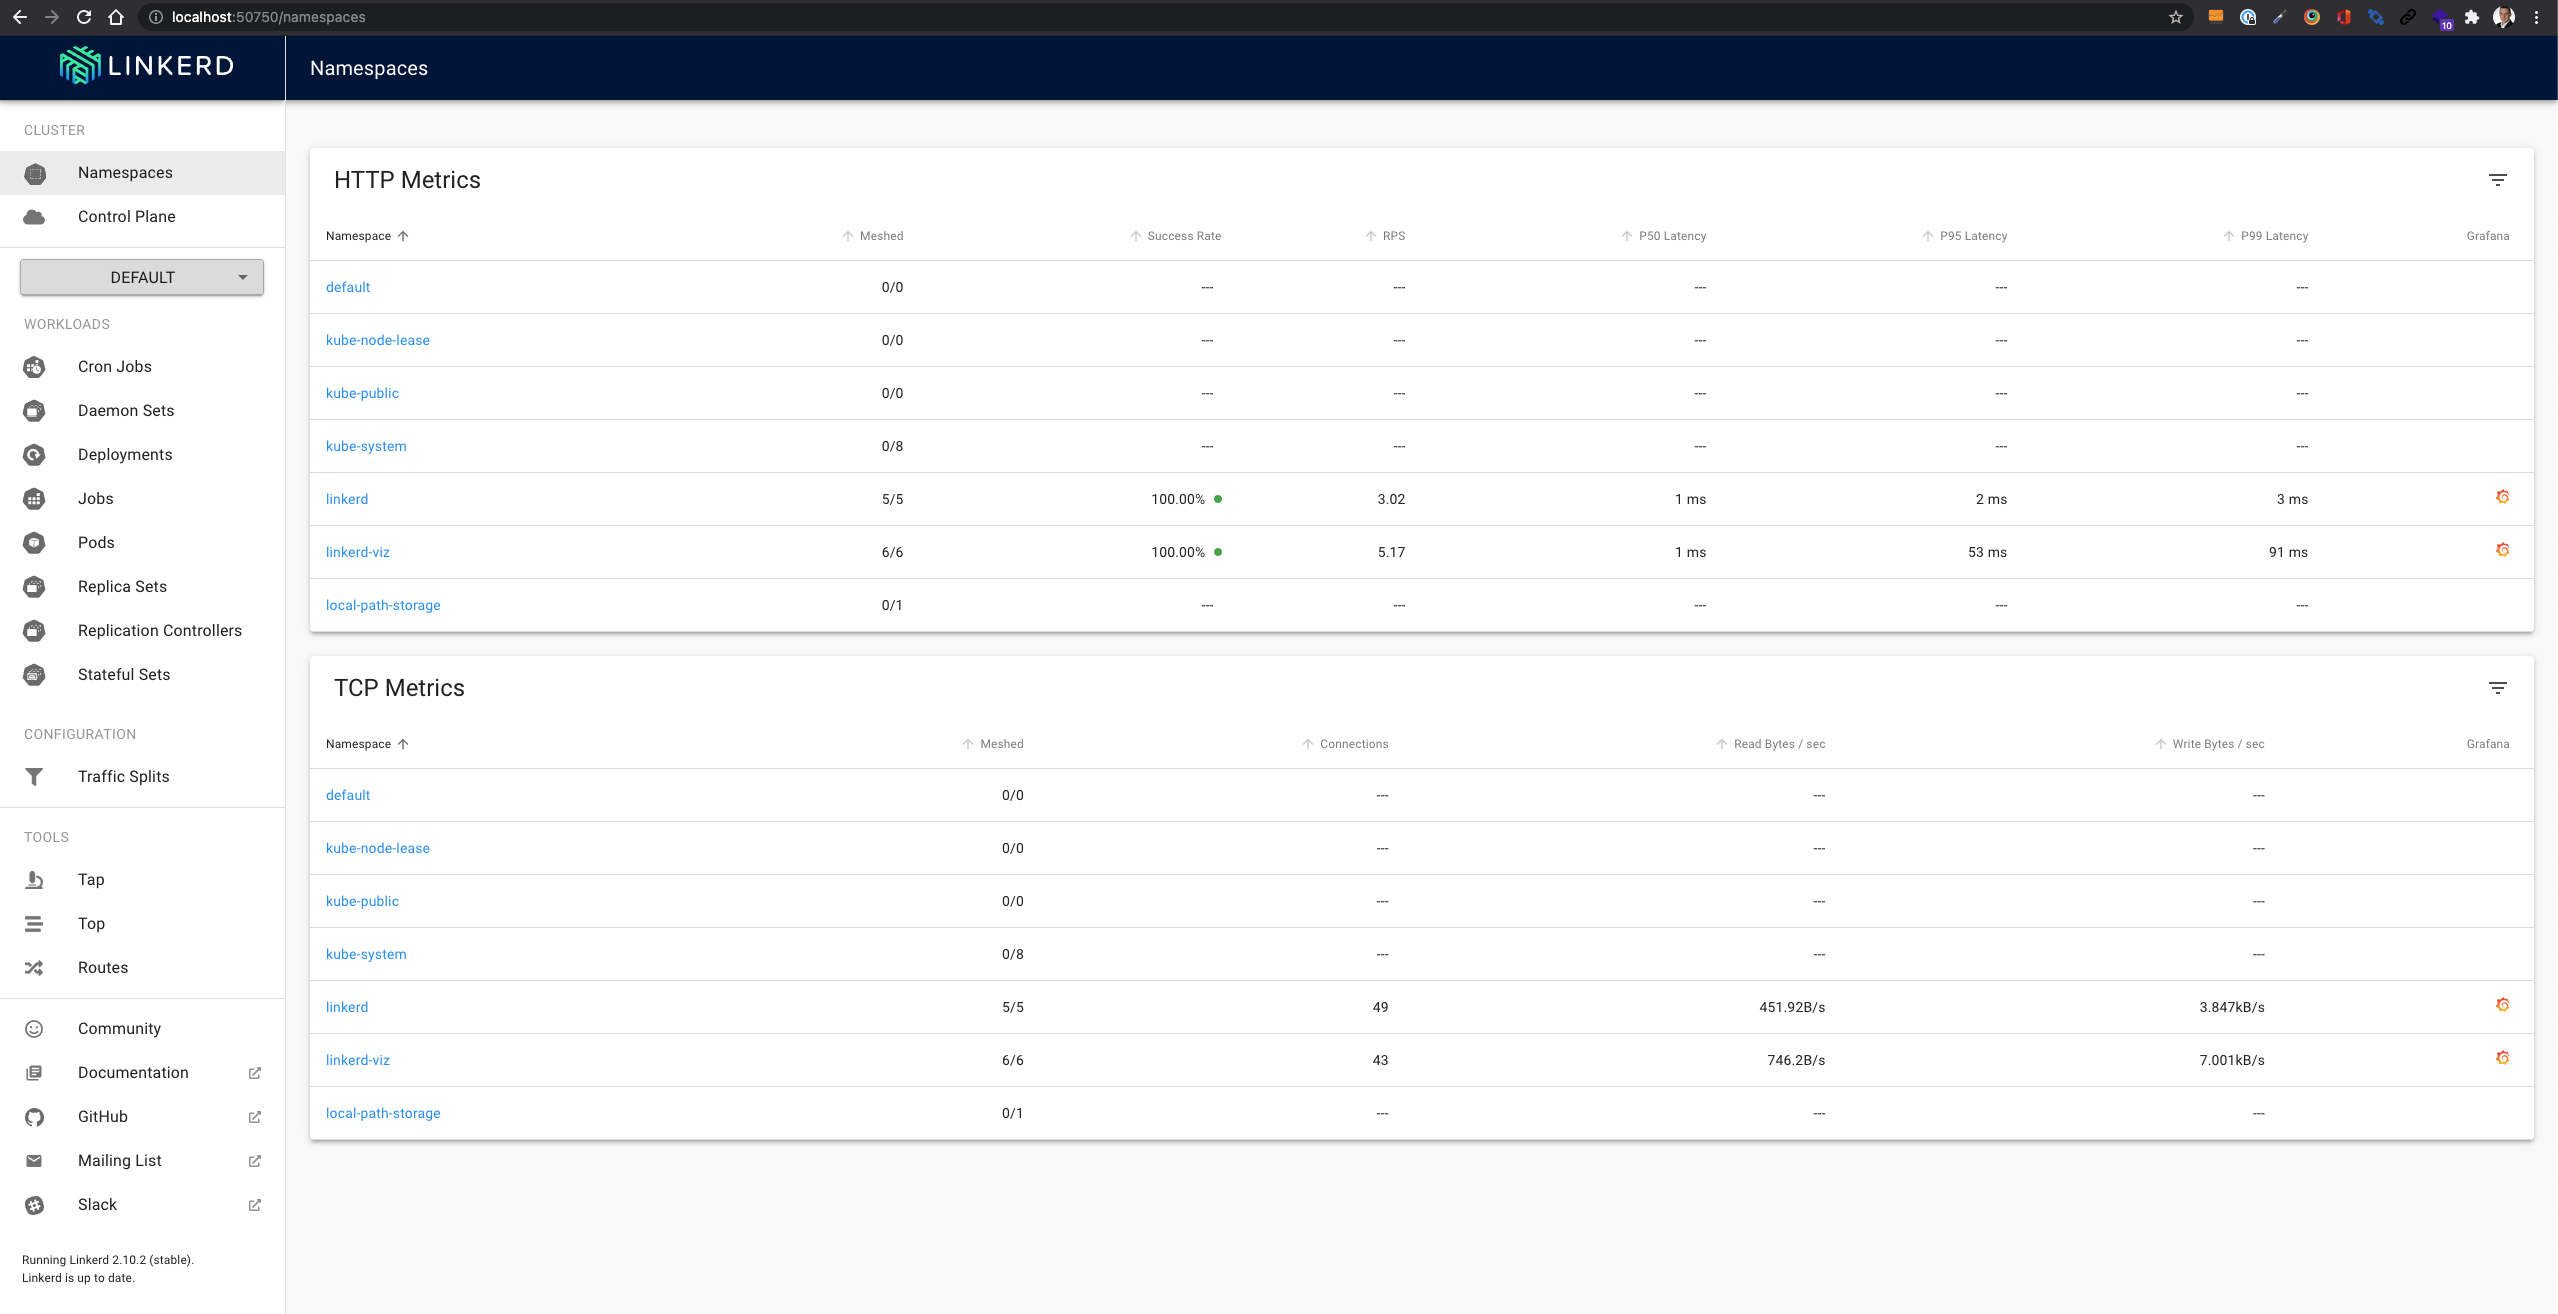
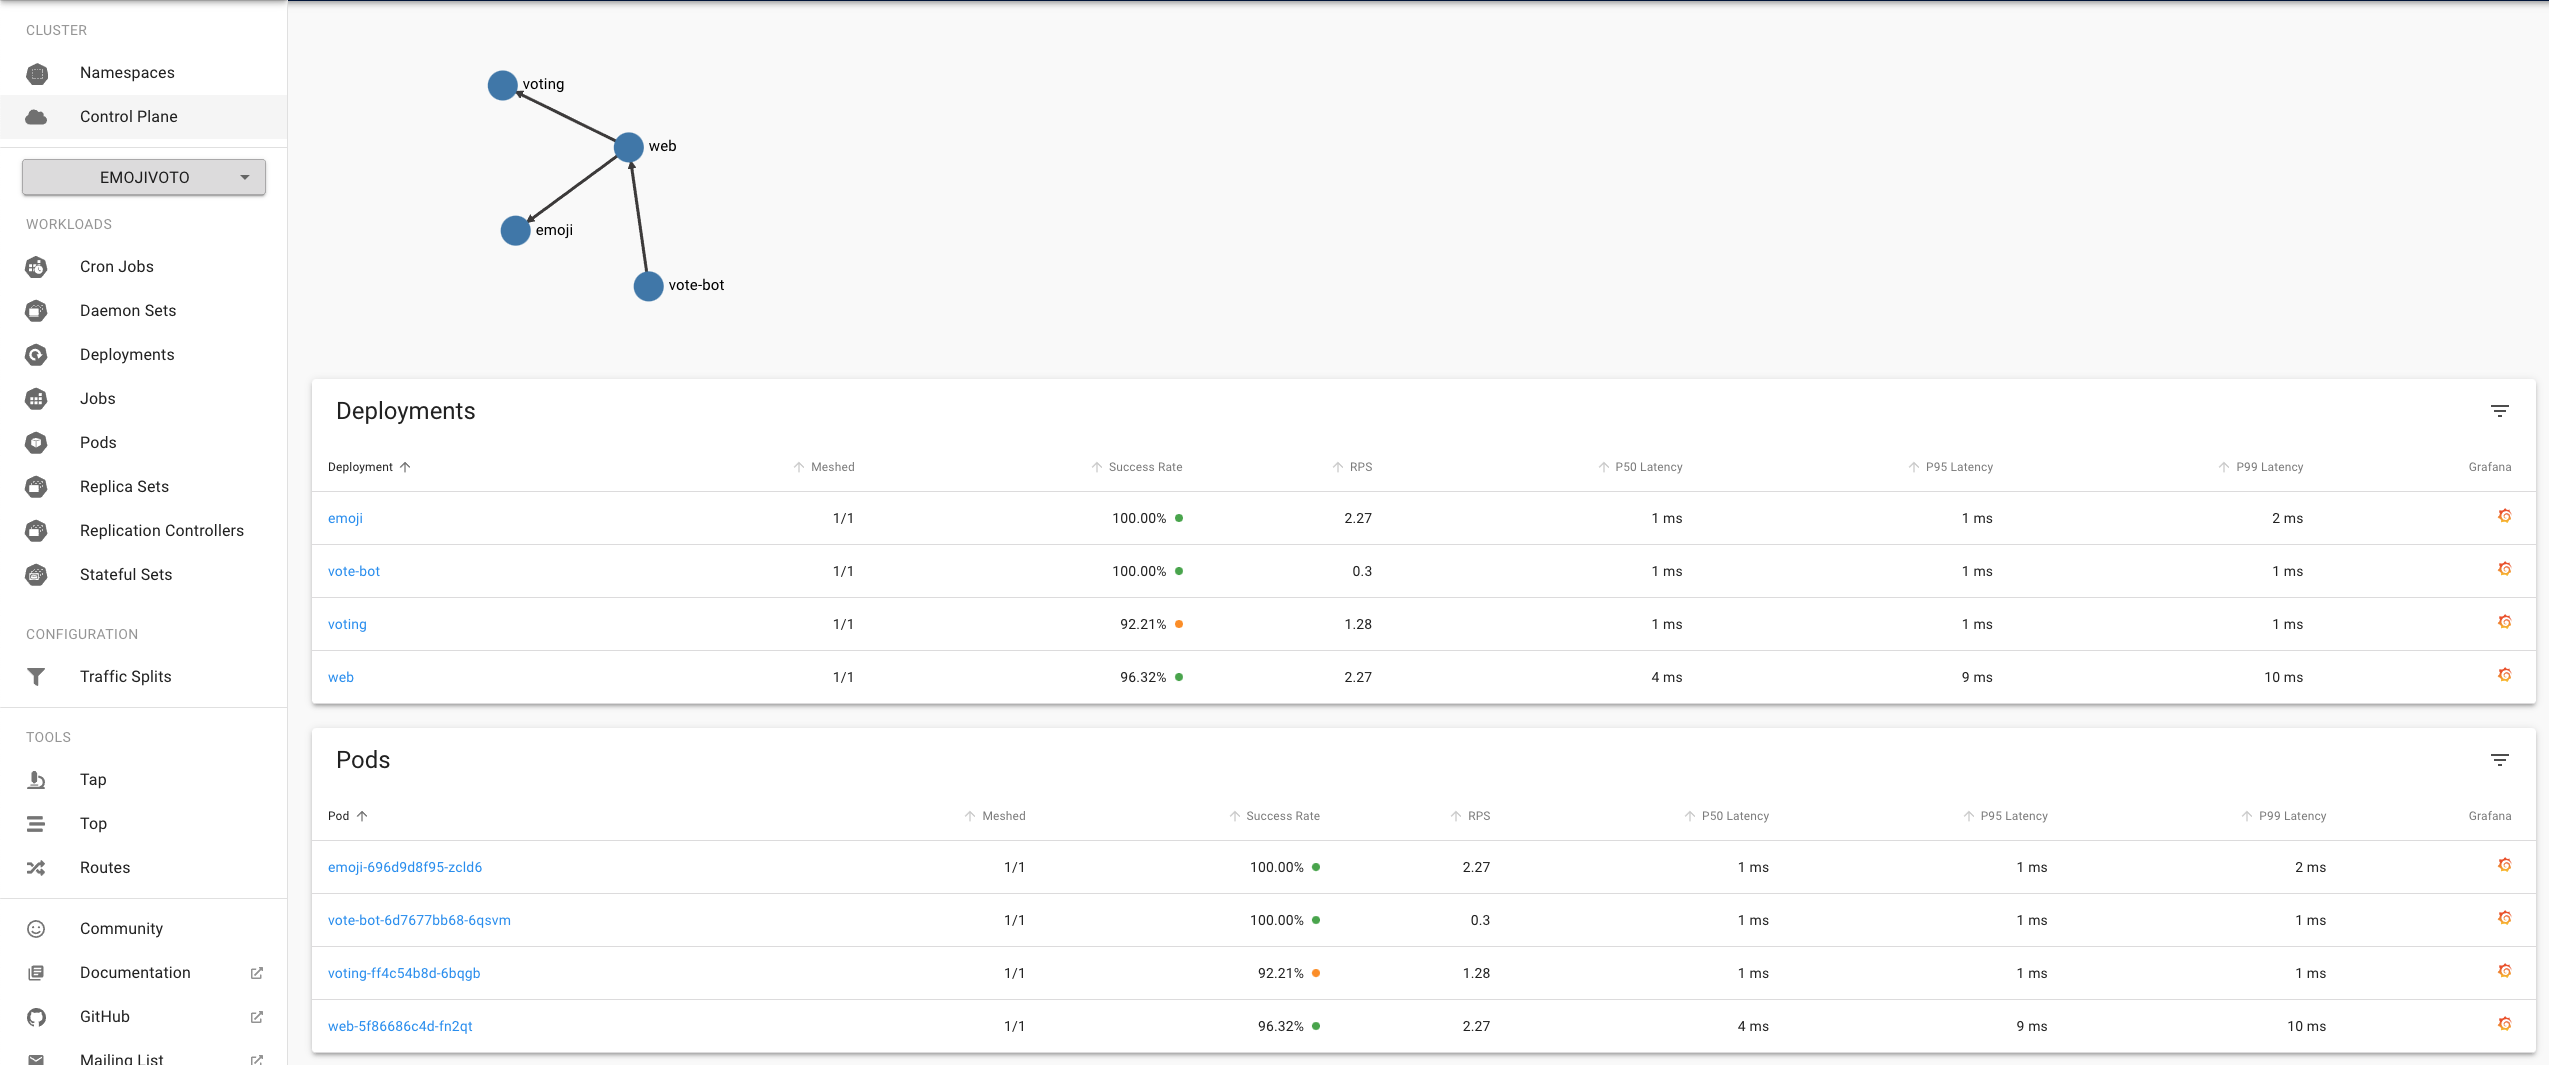
As expected, a look at the dashboard now shows metrics from the application.
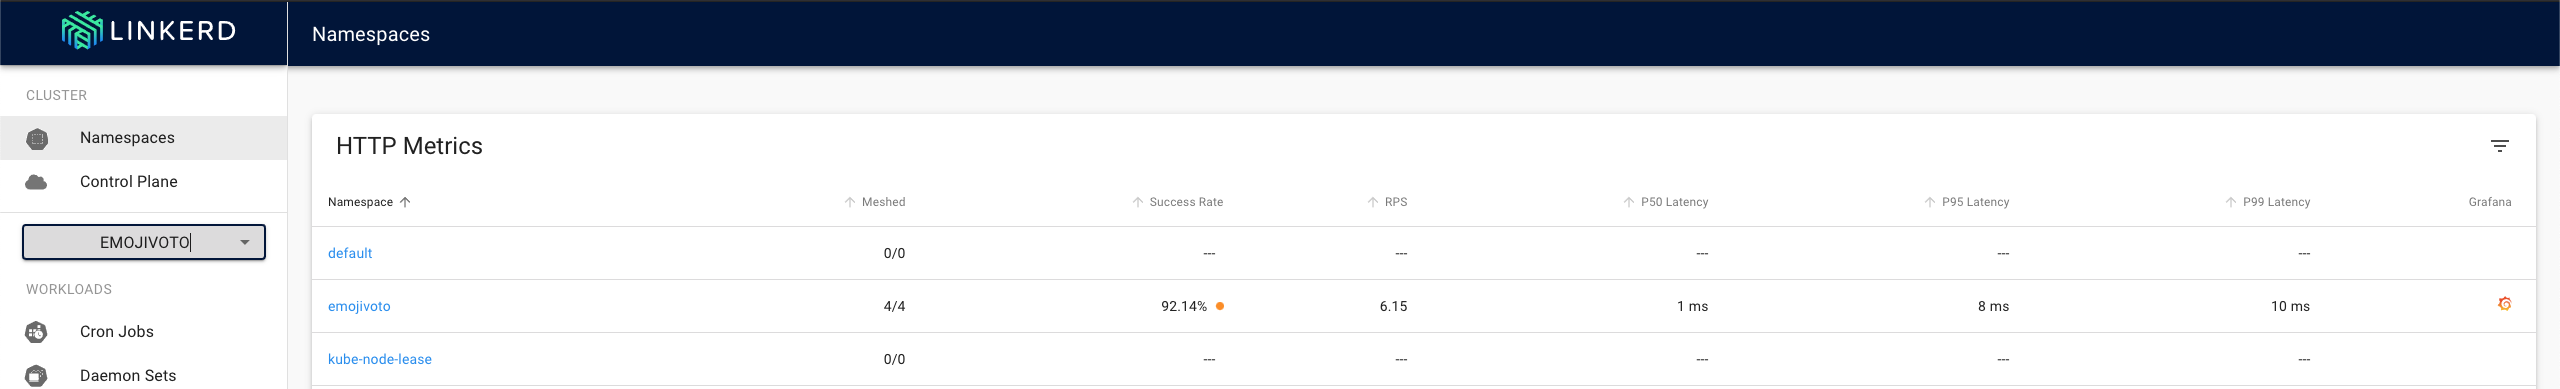
Here we can see the HTTP metrics from the entire namespace. We can now jump to the detailed view by clicking on the namespace, where we can see the individual resources (ie. deployments and pods).
Of course, we can also access this information at any time via the CLI.
|
|
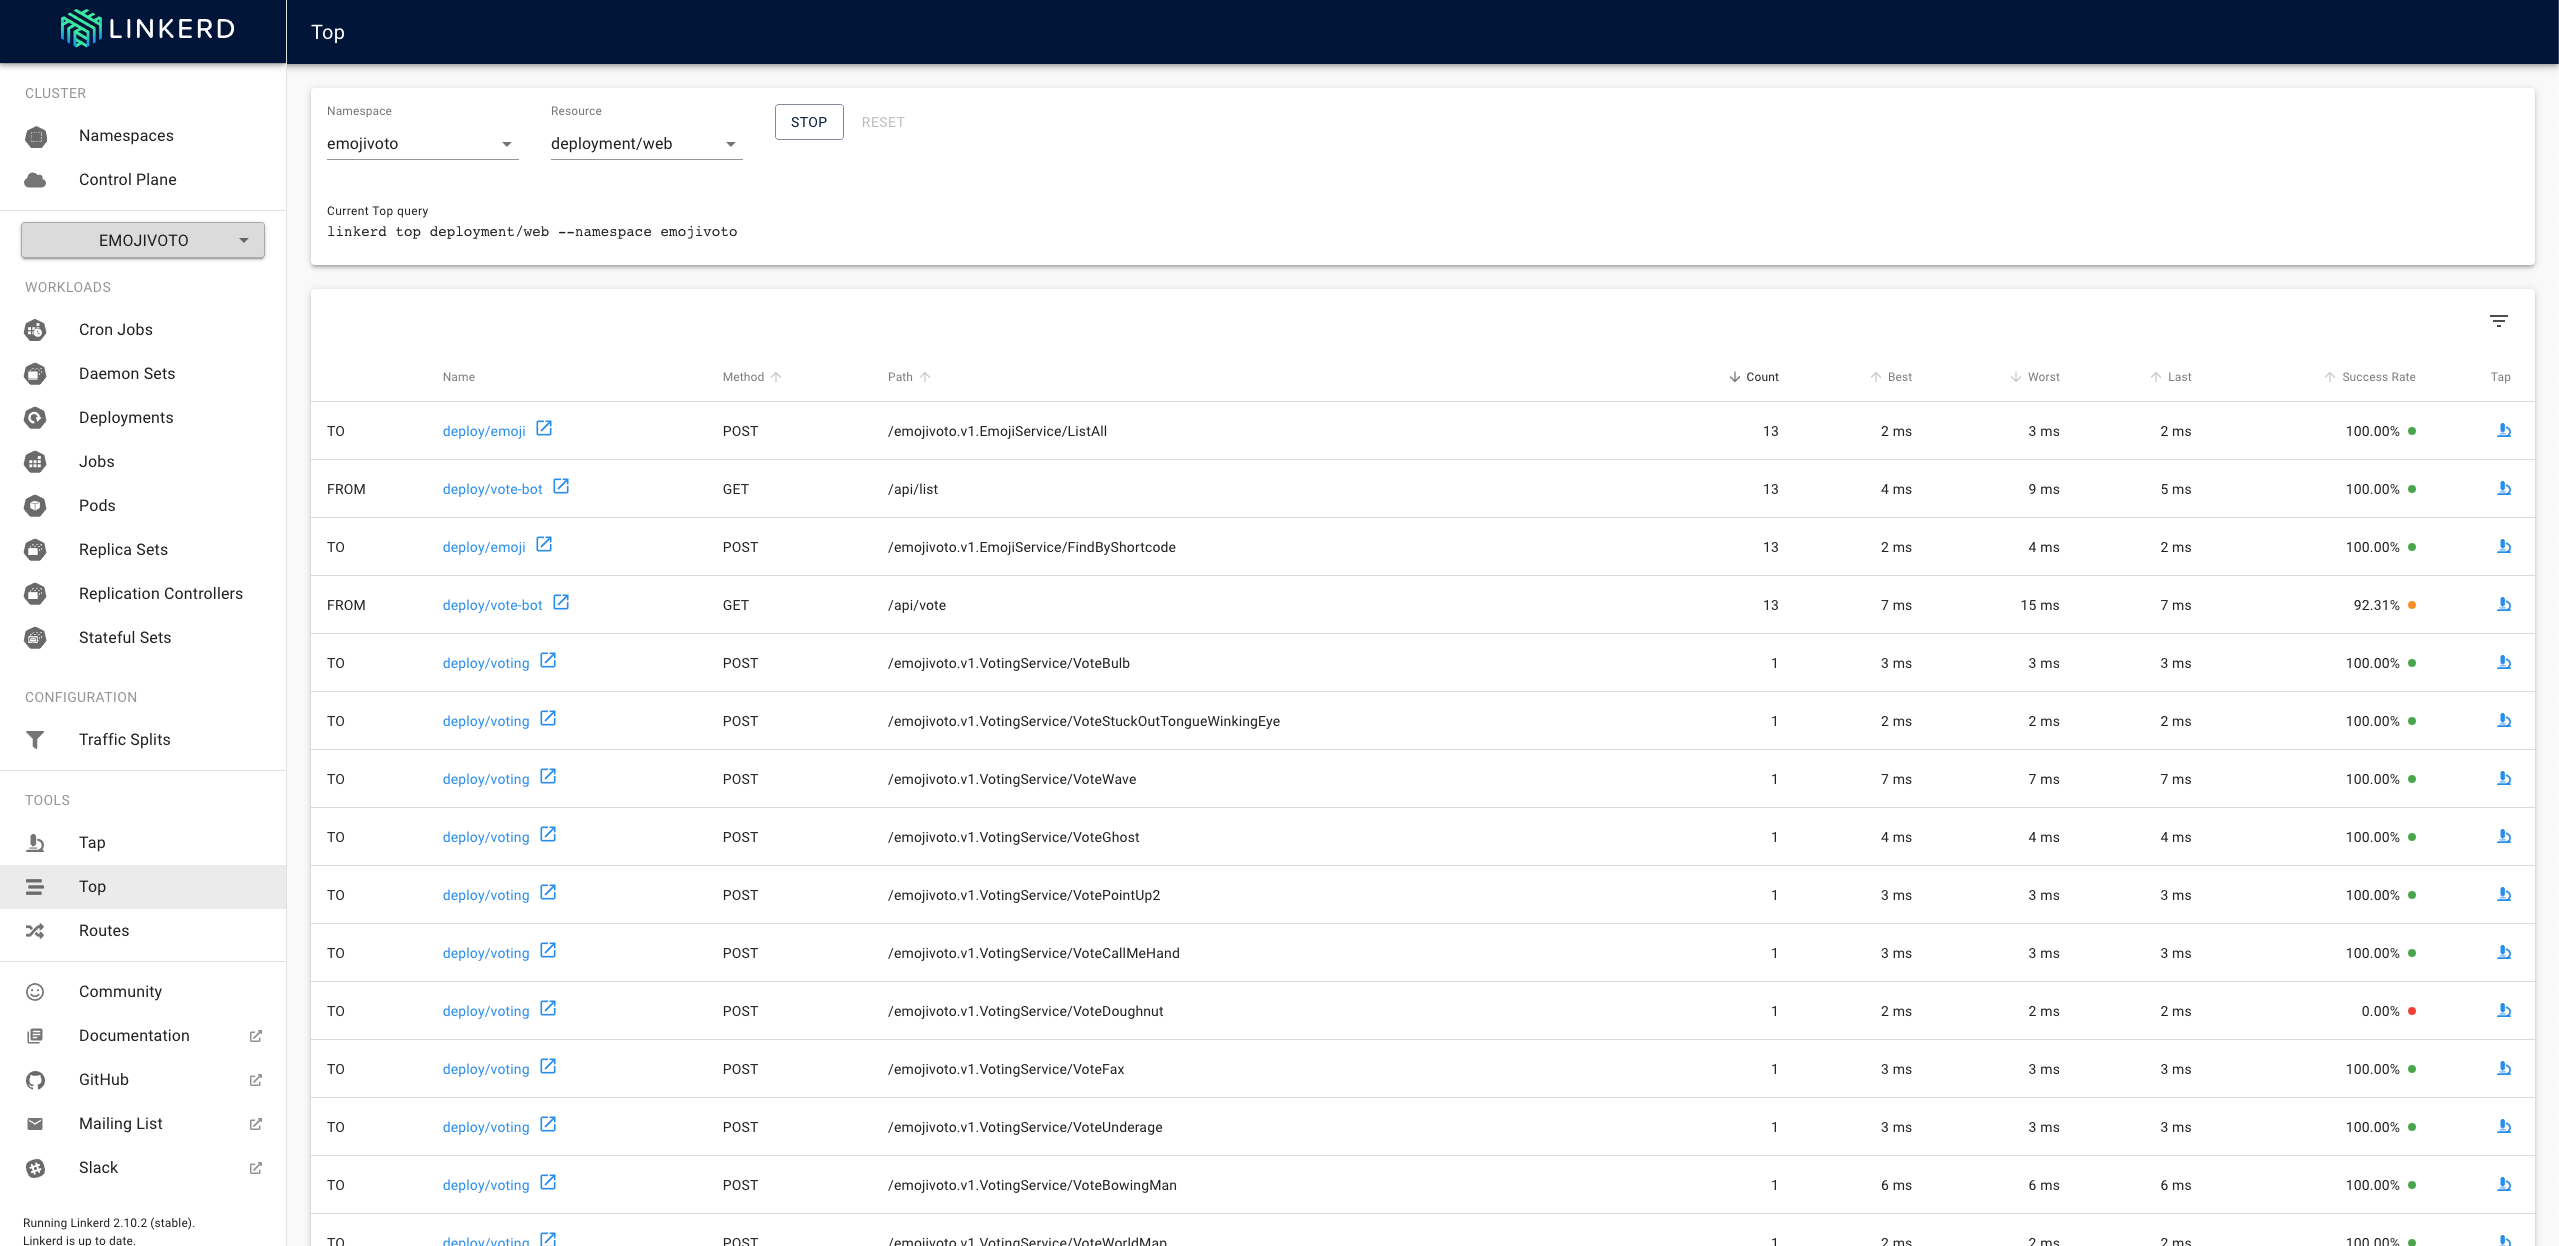
Top & Tap
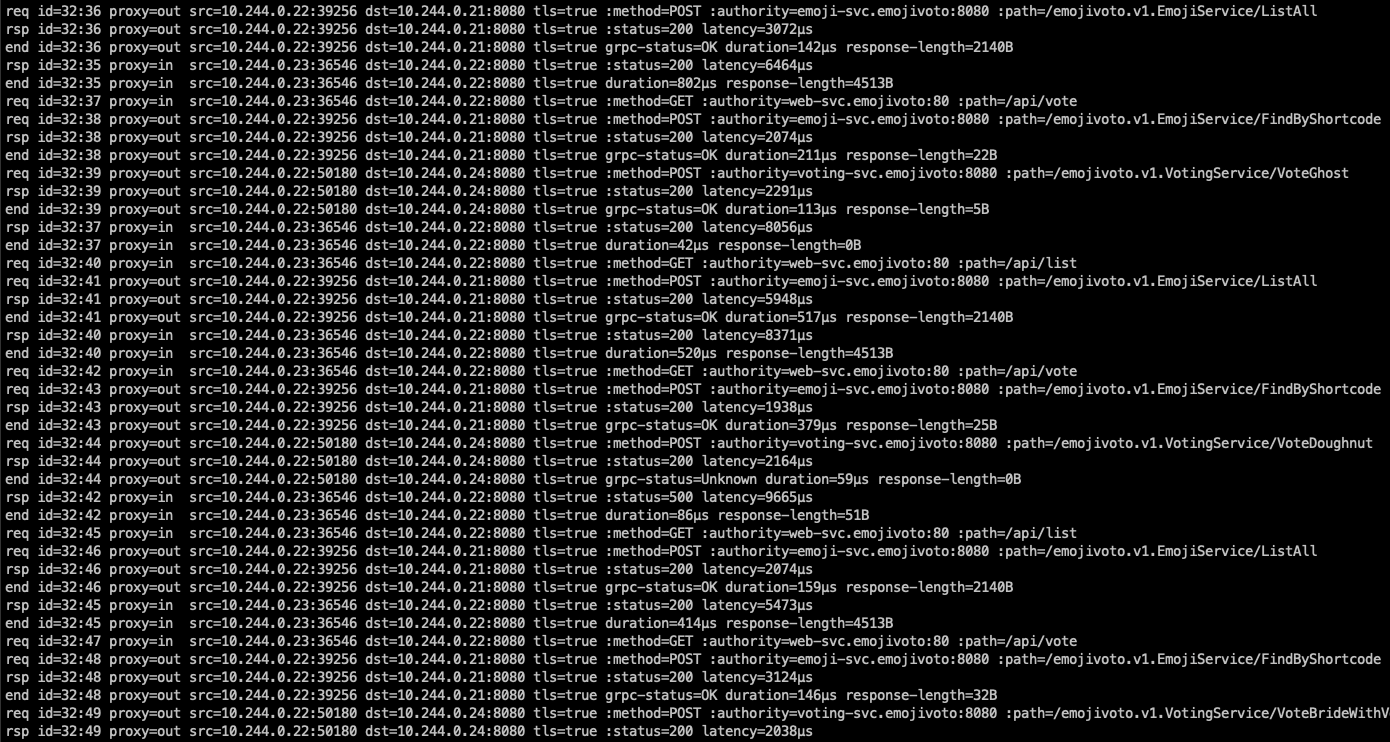
Linkerd gives us two useful tools that we can use to monitor traffic to and from the resources. Top offers us an overview of the individual requests (adds up the same requests), while Tap presents us the complete stream (each request separately).
We have also the option of using both, the UI and the CLI.
Top
|
|
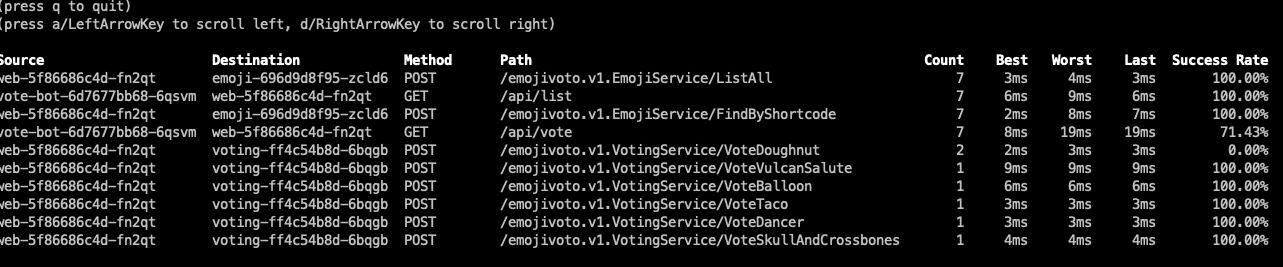
Tap
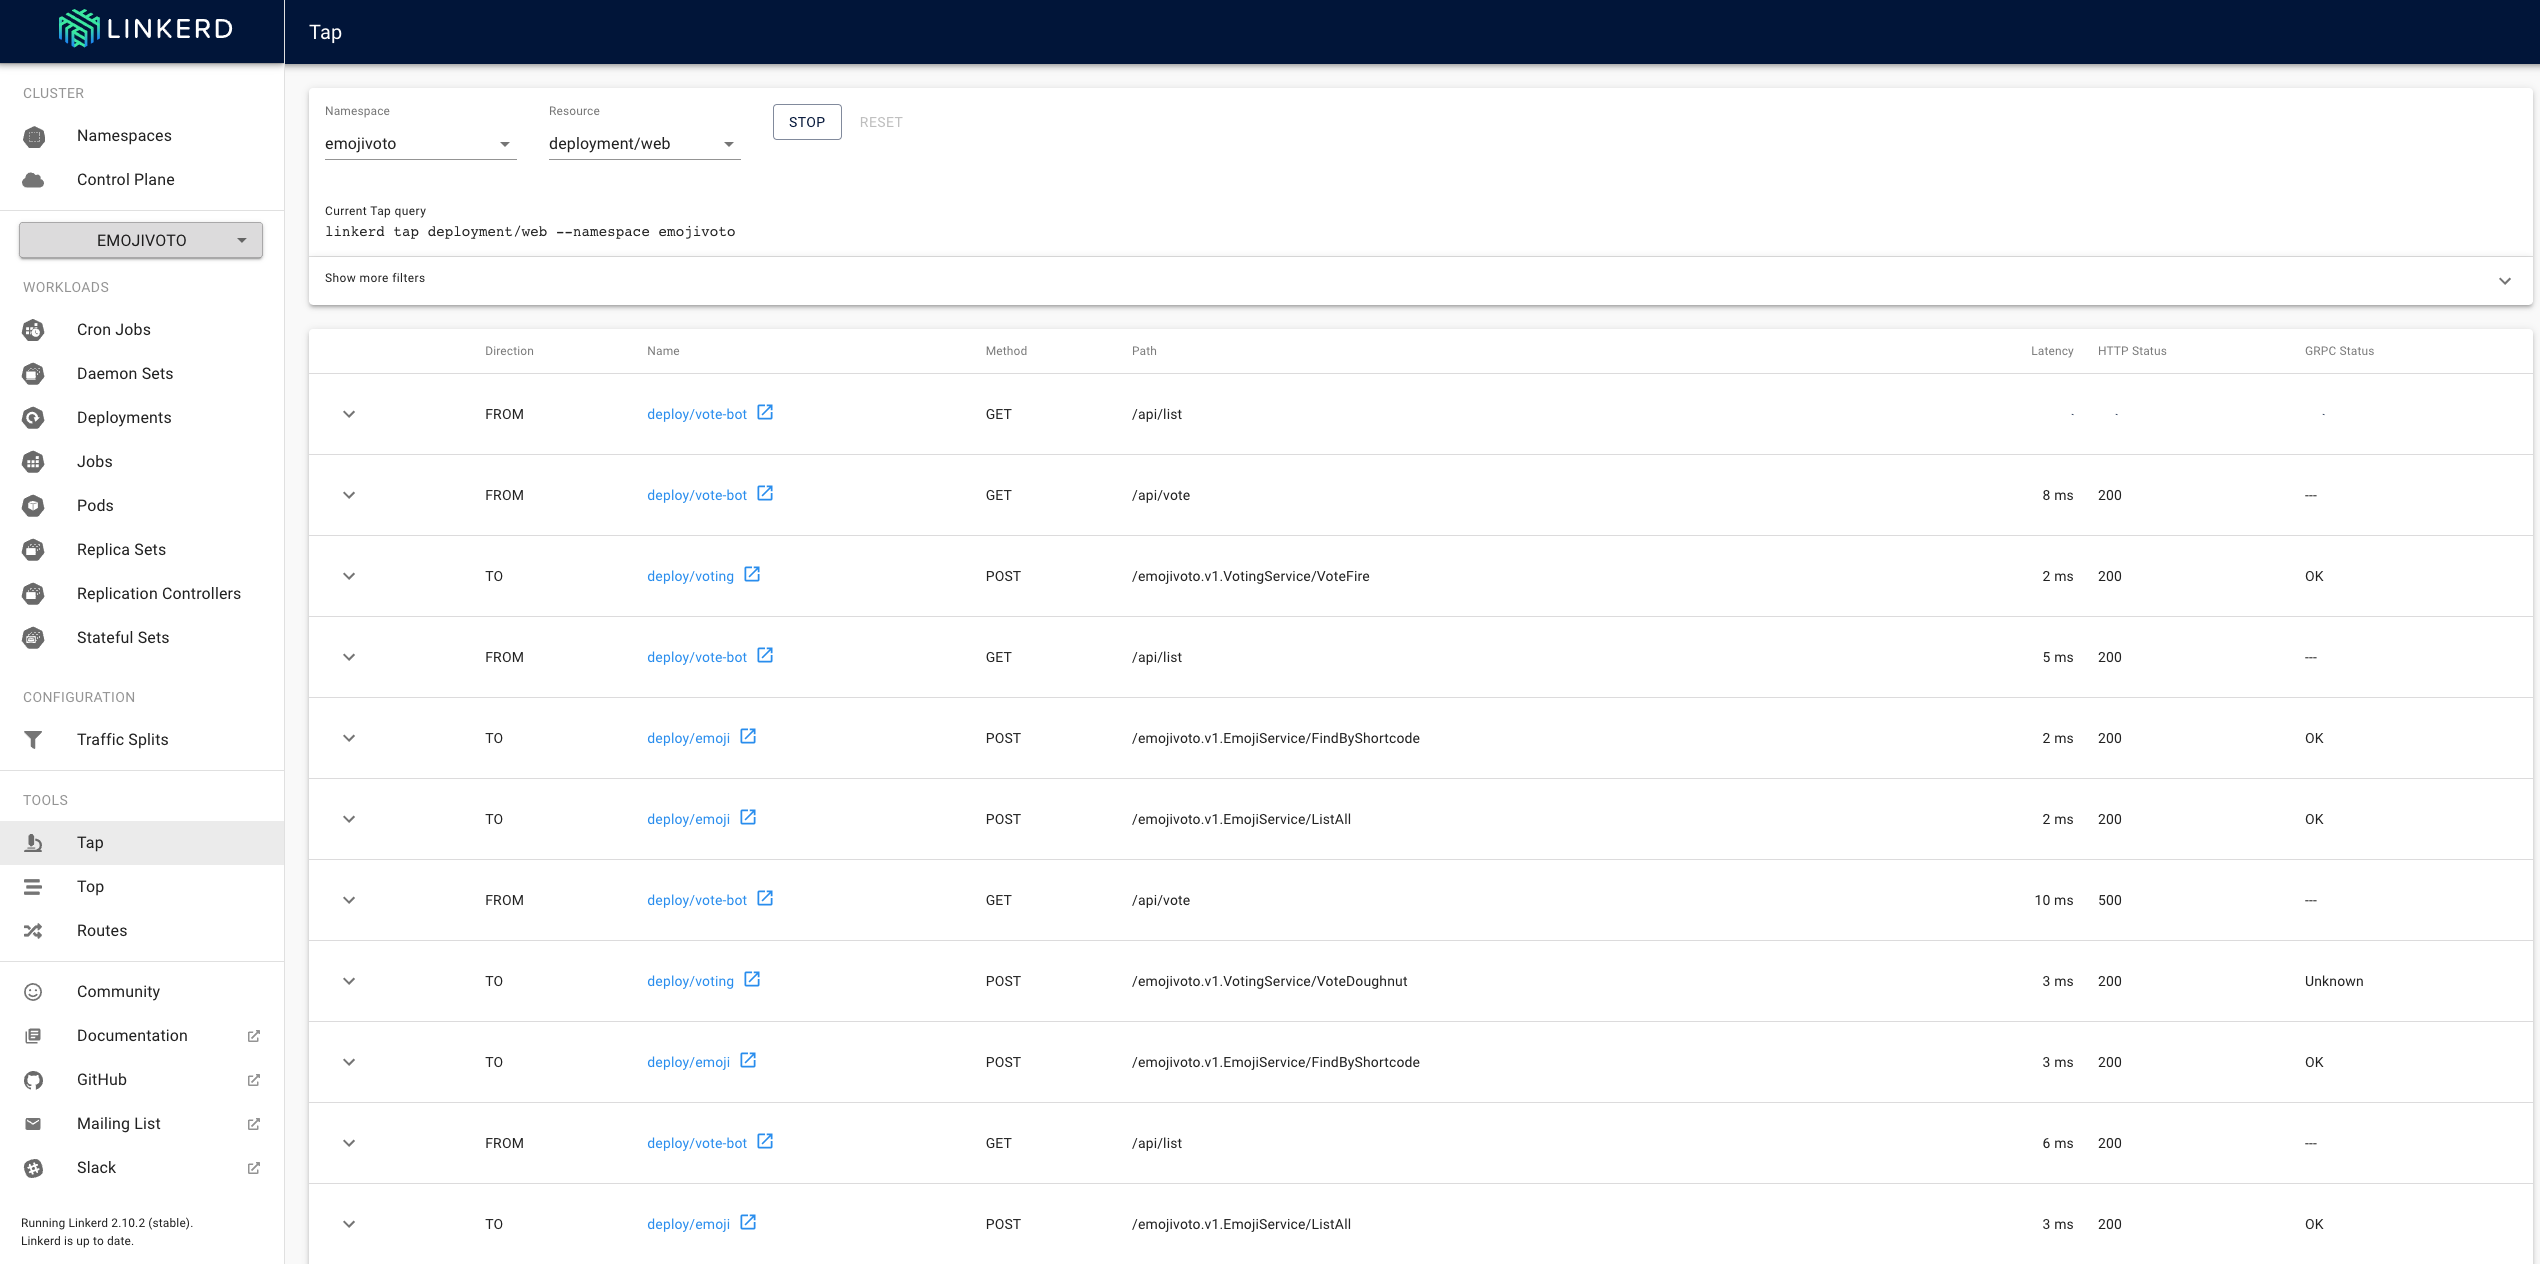
|
|
Closing words
As we could see, linkerd gives us a quick overview of the metrics of our resources. The tool is very clearly structured and, thanks to the sidecard proxies written in Rust, also very efficient and generates relatively little overhead (sidecar image is 114 MB).
In any case, we will continue to deal with the service mesh and show in another blog post how to debug errors in an application with linkerd.
If you have any questions about linkerd or about service mesh, just contact us. We’re here to help.
Stay tuned.
This text was automatically translated with our golang markdown translator.
Stefan Welsch – Pionier, Stuntman, Mentor. Als Gründer von b-nova ist Stefan immer auf der Suche nach neuen und vielversprechenden Entwicklungsfeldern. Er ist durch und durch Pragmatiker und schreibt daher auch am liebsten Beiträge die sich möglichst nahe an 'real-world' Szenarien anlehnen.