Prometheus is an Event Monitoring and Alerting application for cloud infrastructures. The project is written in Go and is one of the Graduated Projects in the Cloud Native Computing Foundation. It is considered the de-facto monitoring in the cloud.
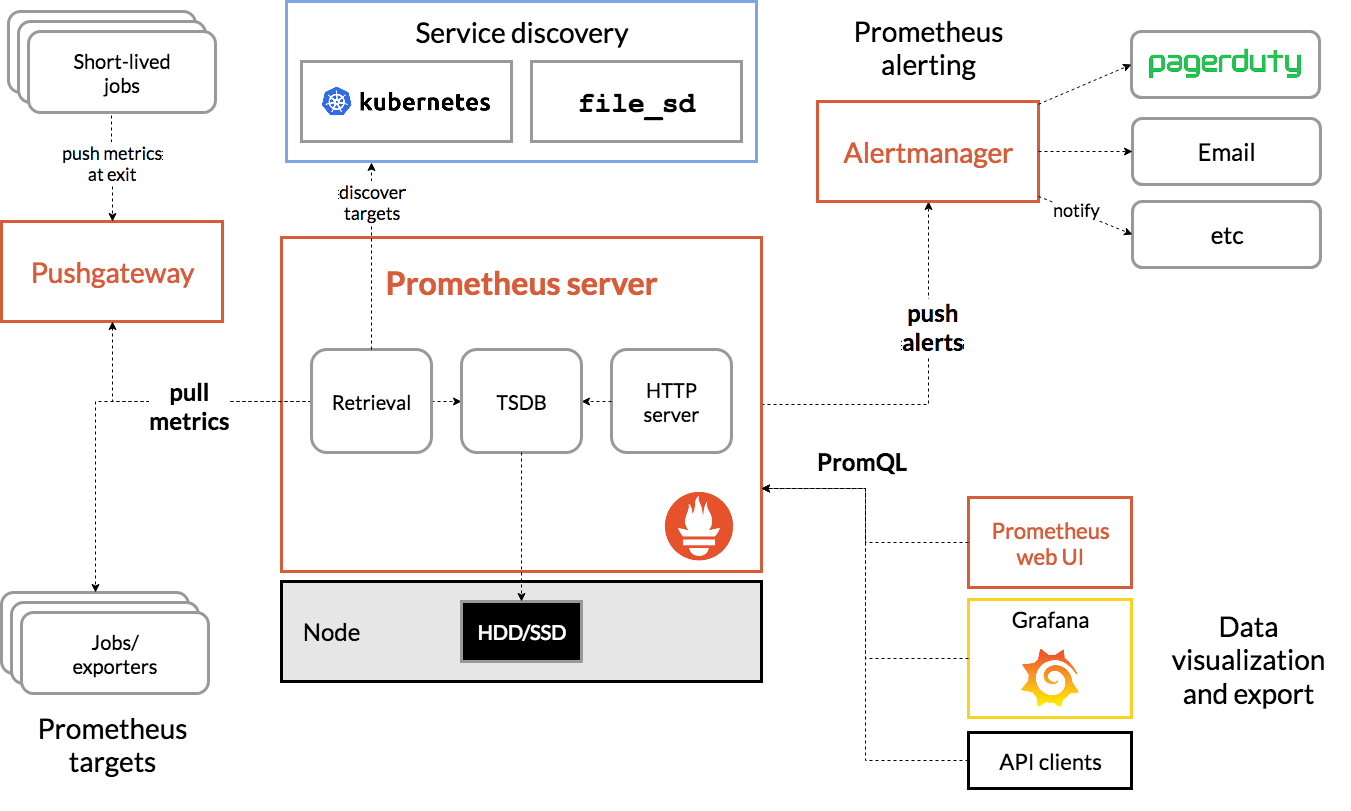
The idea at Prometheus is that a central node aggregates metrics and alerting information. The metrics are included via HTTP pulling from a number of nodes declared in advance. These nodes, also called Targets, expose this information. The Prometheus server aggregates these in a time series database, triggers push alerts if available, and can process the data for further processing through Data visualization tools such as Grafana.
Architecture in brief
Try Prometheus locally
Thanks to its minimalist architecture and uncomplicated installation, Prometheus is easy to use try out.
Start Prometheus Server
Download the latest version from Prometheus.
For example in the version 2.22.2 directly via the terminal as shown here:
|
|
Now unzip the archive, switch into the unzipped directory and start Prometheus via
prometheus -Binary:
|
|
Now the Prometheus Server can be called via localhost:9090. This redirects to one
UI interface under /graph. Another endpoint that exposes all aggregated metrics is under /metrics
visible. The UI looks like this:
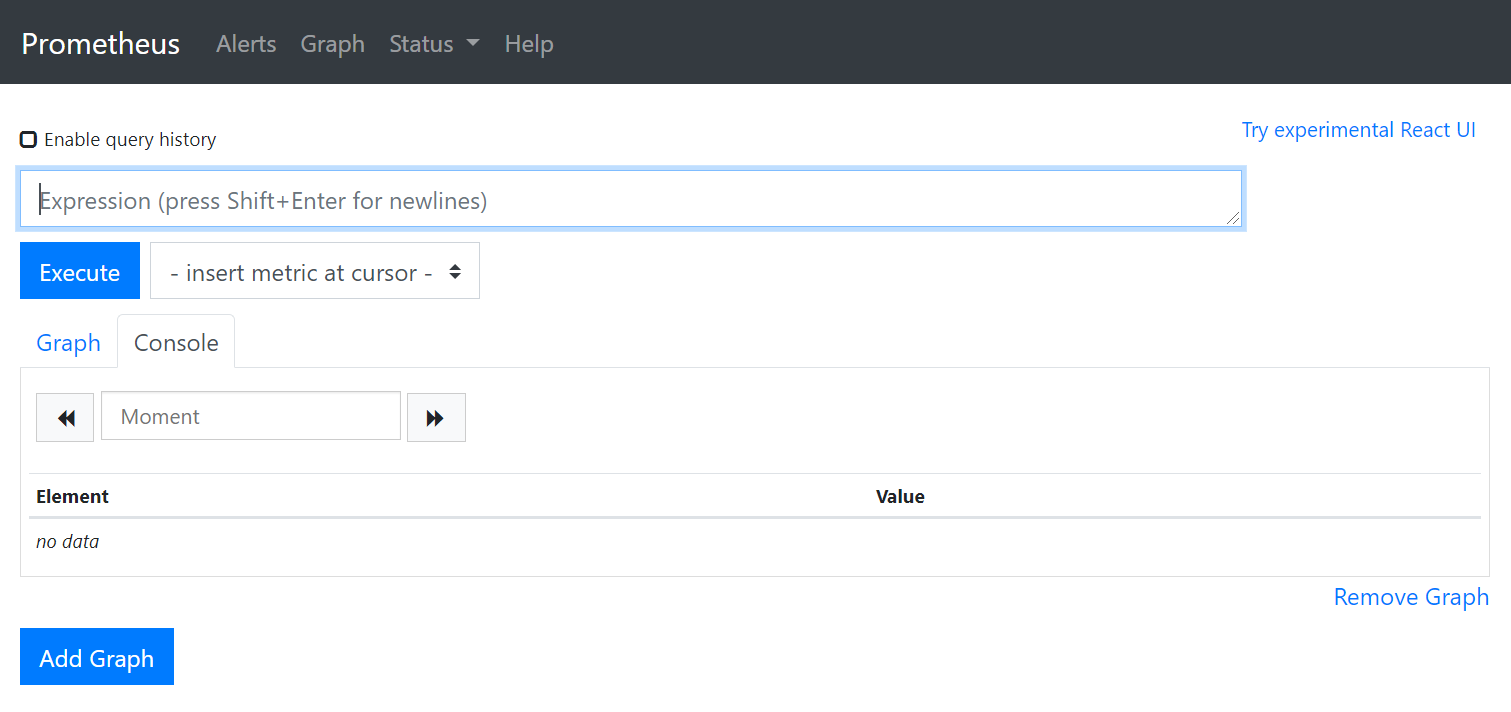
In the UI you can use the in-house query language PromQL to execute queries.
At the moment they are own except for the servers
metrics no other aggregated. To test the PromQL, you can run a sum(prometheus_http_requests_total) query that sums up the number of HTTP calls.
The heart of the Prometheus configuration is the prometheus.yml located in the extracted directory.
With Default it looks like this:
|
|
This shows that Prometheus triggers scraping every 15 seconds, which in turn all metrics of all targets
pulls (pull). Targets are the target systems from which the metrics are aggregated. Well, we don’t have any targets yet
which are scraped, because we still have to expose some. You can do this by clicking on the
target systems run a so-called node_exporter.
Expose targets
Since we are trying out Prometheus locally, we will run the target on the same computer on which the Prometheus Server is running.
Download the last version from node_exporer.
Here still in version 1.0.1:
|
|
Exactly the same as before, unzip the archive, switch into the directory and leave the
node_exporter run like this:
|
|
As soon as this is running, the metrics can be viewed under localhost:9100/metrics.
|
|
The output of the above curl should say something like this:
|
|
This only exposes machine metrics via Default in this form. For more information on process
or to expose the application level, these must be given explicitly to the node_exporter.
Now you have to tell the Prometheus server that it can pull this node. For this, the above exposed
Node to be added to the prometheus.yml:
|
|
After each pull, the Prometheus server now aggregates the metrics that come in via the node.
Next steps
The next step would be how to visually display Grafana with monitoring from Prometheus. That follows in next blog post about it.
Further links
Prometheus | GitHub Prometheus | Cloud Computin 2020 Exercises Prometheus in Kubernetes | CoreOS Blog
This text was automatically translated with our golang markdown translator.