Errors or failures in the productive system often lead to stress, annoyance and resentment. Deliberately causing errors or failures and thereby making the systems more stable and less susceptible always leads to success, joy, reputation and improvement!
Review
Raffi has already reported on our We Celebrate Failure culture in a previous TechUp. Basically, it is about living an active error culture, growing from mistakes and drawing conclusions from them.
In the cloud environment there are so-called chaos engineering tools such as Gremlin or Litmus. If you want to learn more about the theoretical background or about Gremlin itself, I highly recommend the TechUp How to introduce a ‘We Celebrate Failure’-culture with Chaos Engineering into your daily business.!
With Gremlin we have already got to know a closed-source, enterprise-facing player in the chaos engineering part of the well-known CNCF landscape. Today we want to take the step into real Open Source Chaos Engineering.
Litmus
Litmus is an open-source, CNCF sandbox chaos engineering project developed directly by the Cloud Native Computing Foundation (CNCF). Since 2018, over 150 contributors ensure regular updates and releases. The goal of becoming a CNCF Incubating Project is clearly communicated and pursued.
Litmus itself started out as complete framwork for finding weaknesses in Kubernetes platforms and applications running on Kubernetes but is now more titled as Cloud Native Chaos Engineering platform.
Nevertheless, Litmus can only be used in a Kubernetes cluster, but there are connections for other resources such as AWS, GCP or Azure.
Your current mission is:
|
|
Well-known contributors include ChaosNative, Intuit, Amazon, RedHat and Container Solutions.
The notorious version 2.0.0 was only released in August of this year. Version 2 was a release with many extensive feature enhancements. Basically, one can say that version 2 added a lot of enterprise-facing functions. There are two fundamental innovations, there is a new GitOps pattern with an integration with Argo Workflows and a new WebUi. The complete chaos can now be controlled via WebUi and no longer only via CLI.
Litmus itself is based entirely on the principles of Cloud native chaos engineering chaosnative.com/, which include the following properties, for example:
- Open source
- Community Collaboration
- Open API
- GitOps
- Open Observability
Before we venture hands-on with Litmus, let’s get to know the individual components and features.
Chaos Experiments
Simply put, a chaos experiment contains the instructions for actual chaos. The Kubernetes Custom Resource defines parameters such as the image, the necessary permissions, etc.
A classic example here would be a so-called pod-delete experiment, which turns off a specific pod.
For example, you can check the reliability.
There are currently over 50 experiments in different groups such as generic, cordns, kube-aws, kafka, gcp and others.
In the past, many experiments were written in Ansible, most of which were ported to Go Lang with version 2. Thanks to an SDK, which is currently available for Go, Python and Ansible, you can write your own experiments.
Probes
In the Litmus environment, probes are modular tests to assess the state of chaos. In principle, these checks can be used for normal health checks. They determine whether an experiment was successful or whether there were unintended consequences such as an interface failure.
There are currently four different types of probes:
- httpProbe - call a URL, check the result (e.g. based on HttpStatusCodes)
- cmdProbe - Execution of a shell command, exit code is observed
- k8sProbe - Run a CRUD operation against native or custom Kubernetes resources
- promProbe - Run a PromQL query and match Prometheus Metrics
Of course, different probes can be combined.
It should be noted here that for example, an httpProbe uses the correct endpoint from the Kubernetes service. If this sample is incorrectly defined, false results can quickly occur.
Chaos workflow
A chaos workflow is a set of different chaos operations that together form a scenario in the Kubernetes cluster. These steps can be executed either sequentially or in parallel. Behind all this is an Argo CD workflow, which includes several experiments.
Basically there are two types, normal workflows, which only run once or so-called CronWorkflows, which run automatically to a defined schedule. For example, ChaosEngineering can be scheduled and automated. This makes sense from a variety of points, chaos engineering should always be an iterative, recurring process. With a workflow, not only can experiments be installed and thus chaos be triggered, there are also steps that can undo the chaos.
Such a workflow can either be written using YAML or assembled using the GUI in the Chaos Center.
Chaos Result
A chaos result represents the actual result of the chaos experiment. This is also a Kubernetes custom resource definition, which contains information such as the status, etc. This CR is updated at runtime from different pods or CronJobs, so that it always contains the latest version of the individual experiment. In addition, it is not deleted as part of the normal clean-up process and can be used for further evaluation.
Chaos Hub
The Chaos Hub acts as a public marketplace for Litmus Chaos Experiment. Specifically, YAML files for the so-called Litmus Chaos Experiments are hosted here. In addition to the public hub, there is also an option to operate and use one or more private hubs.
From a technical point of view, both a public and a private Chaos Hub are connected to a Git repository.
Chaos Center
The ChaosCenter is at the heart of Litmus, providing the single source of truth for controlling all the various chaos activities.
This web UI is part of the actual installation and can easily be made available in a Kubernetes cluster via Ingress, NodePort or LoadBalancer. Since version 2, this UI has been very popular, since all administration, evaluation, etc. no longer has to be done via CLI, as in version 1. Due to the multi-cloud capability using Chaos Agents, the ChaosCenter can be deployed and used independently of the actual target chaos cluster.
In addition to the functionalities for workflow creation and execution, the ChaosCenter also offers an RBAC administration area, a section for monitoring & observability and other configuration options such as GitOps.
Chaos Agent
The ChaosAgent acts as a process that is installed and running in the target cluster where chaos is to be triggered. There are two types of agent here, the self and the external agent. With the Self Agent, the chaos is injected into the “local” cluster, where the ChaosCenter is also deployed. This is the simple use case where Litmus is installed in the same cluster as the actual application.
With the external agent, other clusters can be connected to different cloud providers (multi cloud).
For this purpose, an agent is installed in the corresponding target cluster with the in-house litmusctl.
Chaos Observability
This area is understood to mean all metrics and statistics that are collected during a chaos run in such a way that Litmus offers the possibility to export all this data in a Prometheus format.
Hands On
Installation
To be able to try Litmus now we need a Kubernetes cluster, in our case we use miniKube.
Unfortunately, due to an error, we have to use an outdated Kubernetes version (< v1.22.x):
|
|
Now that our Kubernetes cluster is up and running, we want to install Litmus into a special namespace via Helm Chart.
|
|
We can then check via kubectl get pods -n litmus whether our three Litmus pods are running.
Here we see three pods, a frontend, a server and a MongoDB.
Litmus uses the MongoDB here to store all relevant data, logs etc. about the actual chaos.
The front end represents the actual chaos center and the server pod acts as the API center.
Chaos Center
As soon as these are all running, we want to take a closer look at the ChaosCenter dashboard.
For this we use the NodePort address of litmusportal-frontend-service, but with MiniKube we first have to open a tunnel with the following command:
|
|
We can then log in with the data admin/litmus and have successfully landed in the chaos center!
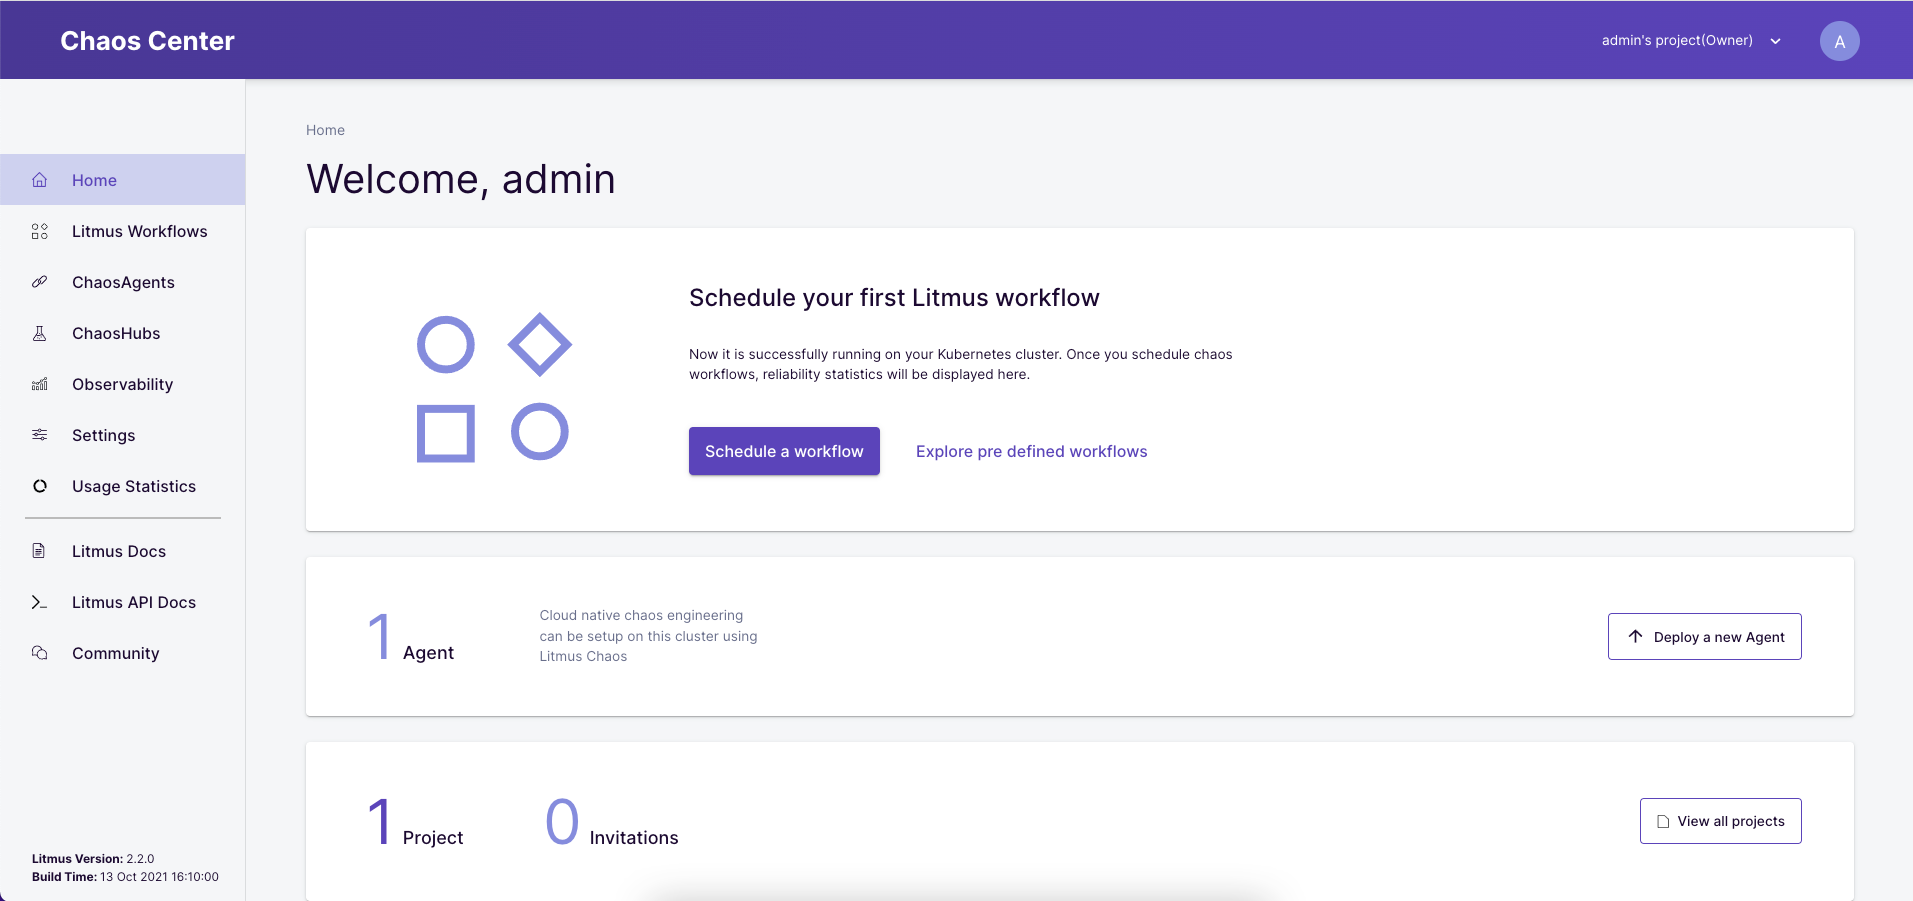
With the first login, Litmus starts some more pods, which are needed for the chaos. Technically a Litmus project (left upper side in the dashboard) was created. All these pods are required for the Chaos Self Service, in addition the Self Agent is installed in the cluster.
Luckily, Litmus offers a complete demo project that can be self-service installed.
We can start this by starting a new workflow using the Schedule a workflow button.
As an agent we use our self agent here, then we select the predefined chaos workflow podtato-head from the Litmus ChaosHub.
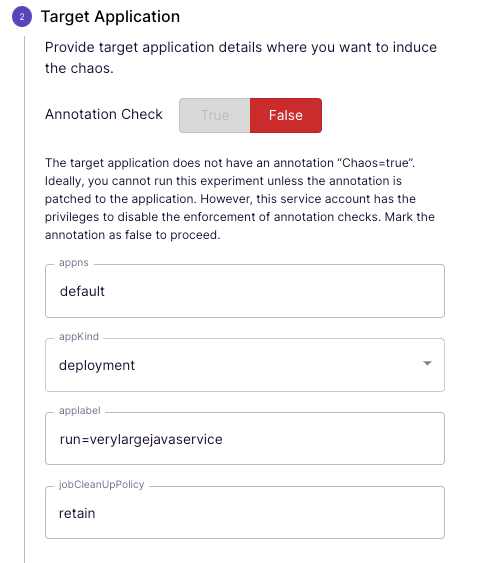
In the fourth step, we want to take a closer look at our sample.
For example, here we see that a variable is used for the namespace and the deployment with the label name=podtato-main is supposed to get the mess.
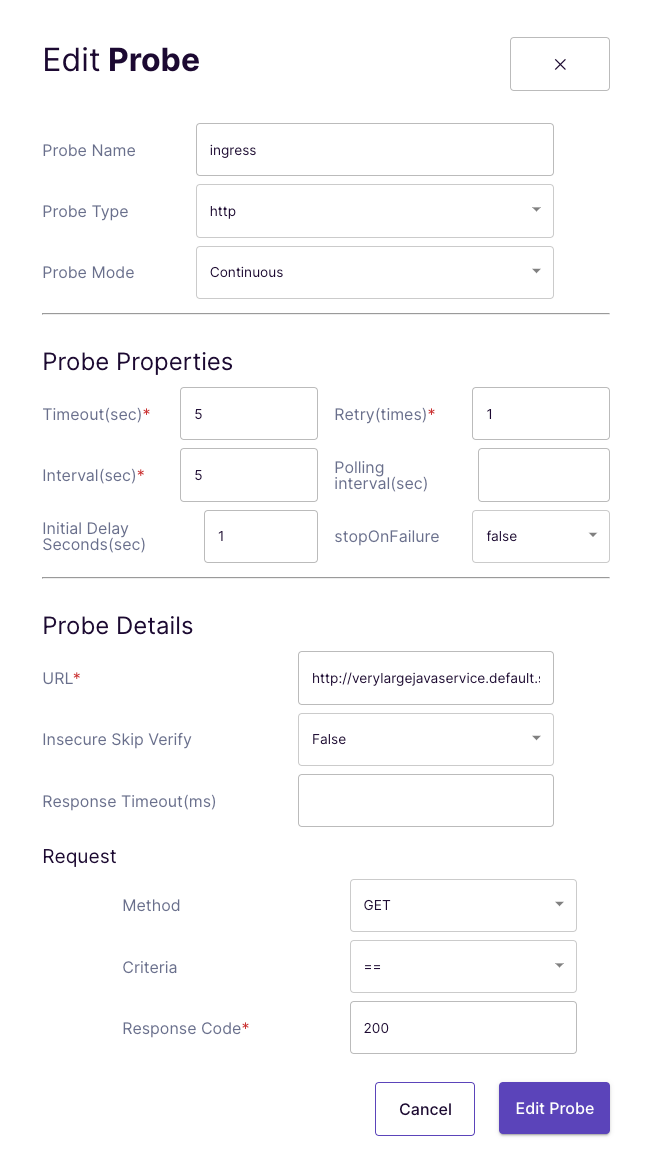
In the settings of the httpProbe we then see further information such as the URL, the set timeouts and intervals and the expected response code of 200.
In the next step, we can then use the Reliability Score to define the weight of this workflow. Since we want to trigger and test the chaos immediately, we choose Schedule now and start the chaos.
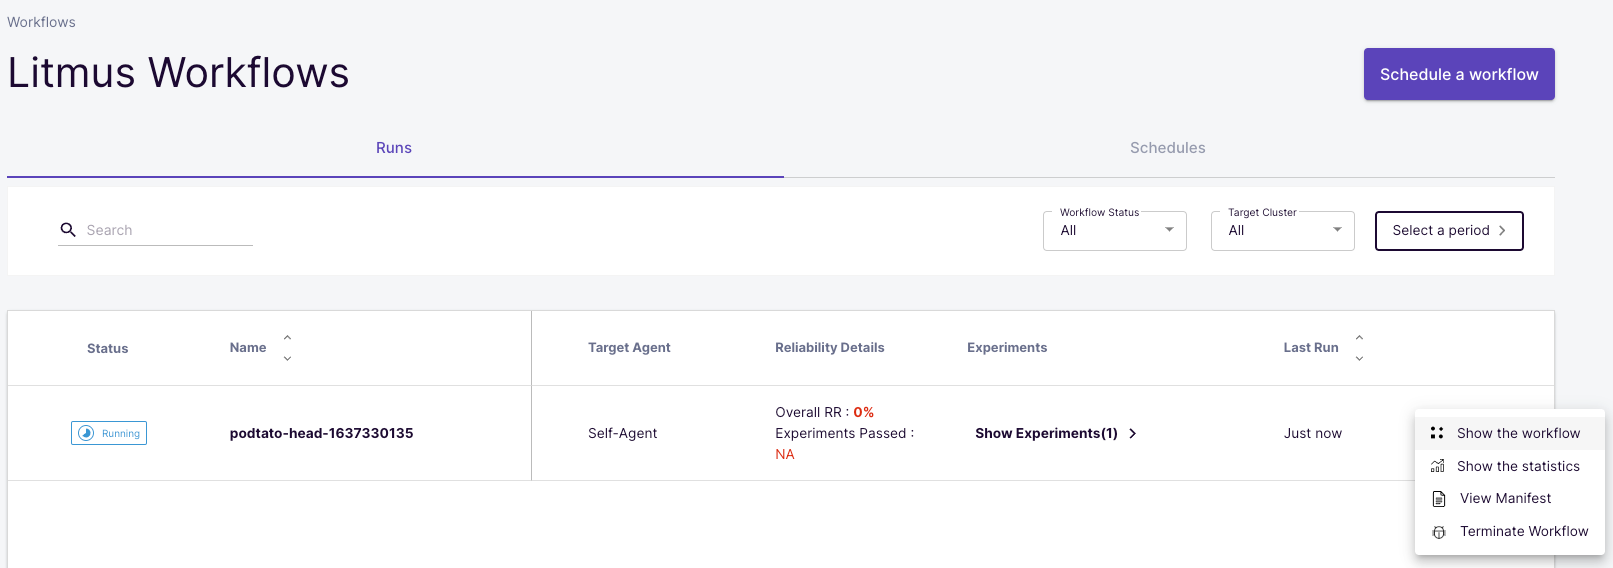
Now a so-called Run of this workflow has been started in the Litmus Workflows menu.
We can use the options to view the workflow in detail or examine other statistics.
This workflow should run successfully and shows us that deleting a (or multiple) pod has no impact on the stability and availability of our application!
The first custom workflow
But now we want to define our own workflow for a demo application known from other TechUps.
For this we use the edgey-corp-nodejs application from our Telepresence TechUp (Check it out!).
We start this via kubectl in the default namespace and then open the port to be able to reach the K8s service.
|
|
After the pods have started, we can briefly check the correct functionality of the application via the URL from the MiniKube command by calling this URL in the browser.
We then add a label to clearly identify our pods and deployments. For this we use a label that already exists on the pod for the deployment.
|
|
Now we could define a workflow with an httpProbe with the URL, which we can call up in the browser via MiniKube.
This wouldn’t work from the cluster though, so we need to first find out the correct URL for our service and verify this from the litmus namespace.
From a technical point of view, we can either take the internal IP of the services here and we use the DNS name verylargejavaservice.default.svc.cluster.local known internally to Kubernetes.
To do a quick test, we start a busybox pod to deploy a curl from the litmus namespace.
|
|
We can execute the second command after a short wait, we get an HTML structure with the title Welcome to the EdgyCorp WebApp everything looks fine as a response.
But now quickly to our first own Litmus workflow.
As before, we start a new workflow with Schedule a workflow, select the self agent again and then Create a new workflow using the experiments from ChaosHub.
In the fourth step we can now add an experiment and see a list of all experiments that are currently available on the public ChaosHub.
For simplicity, let’s go back to the generic/pod-delete scenario and configure it as follows:
What is very nice here is that Litmus knows the namespaces, labels, etc. from the cluster and gives us suggestions.
For the test we use an httpProbe again and want to make the calls to the previously checked DNS name. In any case, we expect an HTTP response code of 200 (Success) as a response.
It is important here that the timeout is set accordingly, otherwise the probe will recognize that there is downtime, although the application is “only” responding too slowly.
We can confirm all further steps with Next, in the last step we can take a closer look at our YAML. It is immediately apparent that this is a ArgoCD Resource. With a GitOps approach, this YAML would then be pushed versioned into a repository.
Is our application resilient?
After we have created our workflow, it will start immediately. After a short wait, we see the sobering result that the result is red and that the application has failed.

Through the details of the workflow, we see the logs and the chaos result and quickly find out that our httpProbe failed.
Just by running the kubectl get deployments command we can see the reason for this failure and lack of stability.
Do you see it too?
In our experiment, we deleted a pod, but since our deployment only has one replica, there was a failure.
But now we want to have a sense of achievement and want to make our application more stable, for this we scale up the deployment to a total of two pods with the following command:
|
|
After a short wait, we see that two pods of our service are now running. In the Litmus Workflows menu item, we can now trigger a rerun in the Schedules tab to trigger our chaos again.

Now we see that the workflow shows 100% stability, and we have successfully tested and improved our application! 🚀
Advantages & Cons
A very clear benefit is Litmus’ GitOps approach. You often have a great, well-functioning web UI to create or manage resources, but the changes are usually applied directly in the cluster and are not persisted anywhere. Litmus offers the setting option to save all resources via GitOps process in a repository as a single source of truth. Another advantage is the use of ArgoCD workflows under the hood. This makes Litmus reliable and stable, and also sort for a yaml-based approach.
In principle, the open source approach with well-known contributors and a really wide range of functions is certainly an advantage.
A clear disadvantage at the moment is certainly the compatibility. In our test, Litmus could not be used with the latest Kubernetes version, and this clearly needs to be improved. In addition, one often hears the argument that Litmus should “only” be used for chaos engineering in the Kubernetes environment, but not in the infrastructure. Improvements may also be made here, for example more experiments for the actual infrastructure such as AWS or similar could be offered.
Conclusion
Litmus wants to achieve great things, that’s for sure!
Unfortunately, there were always problems when trying it out, which were not directly described in the guide. But these will certainly be fixed promptly, then nothing stands in the way of open source chaos engineering with Litmus.
Stay tuned!
This text was automatically translated with our golang markdown translator.